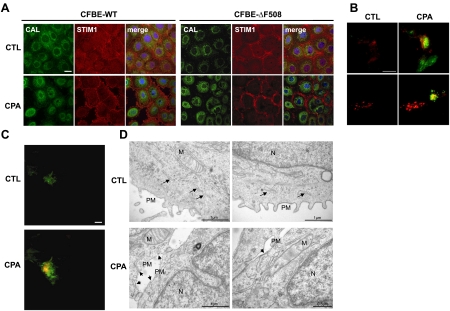
Figure 4.
ΔF508-CFTR does not influence the translocation of STIM1 and the ER toward the PM after Ca2+ store depletion. A) Confocal images of CFBE-WT and -ΔF508 cells showing STIM1 (red), the ER-resident protein calreticulin (green), and the nucleus (DAPI, blue). Top panels: control conditions (CTL). Bottom panels: after treatment with 10 μM CPA. B) TIRF microscopy of HEK-ΔF508 (top panels) and -WT cells (bottom panels) expressing STIM1-GFP and Orai1-mCherry (kindly provided by Richard Lewis, Stanford University School of Medicine) under control conditions (left images) and after store depletion with 10μM CPA (CPA; right images). Only the red labeling of Orai1 was detected under control conditions; however, green STIM1 was recruited to the PM after CPA treatment. Yellow indicates regions that contain both GFP and mCherry signals, suggesting colocalization of STIM1 and Orai1. C) HEK-ΔF508 cells were transfected with Ds-Red-KDEL (ER marker) and GAP-GFP (PM marker) and imaged using TIRF microscopy. Top panel: only the green PM was detected under control conditions (CTL); ER (red) was not observed. Bottom panel: after store depletion (10 min CPA), the ER appeared and became colocalized with GAP-GFP, indicating movement of the ER close to the cell surface. D) Representative electron microscopy images before (top panels) and after CPA treatment (bottom panels) in CFBE-ΔF508 cells. Nuclei (N), mitochondria (M), and ER (black arrows) are shown. After CPA treatment, the ER was clearly juxtaposed with the membrane. Scale bars = 20 μm (A–C) or as indicated (D).

