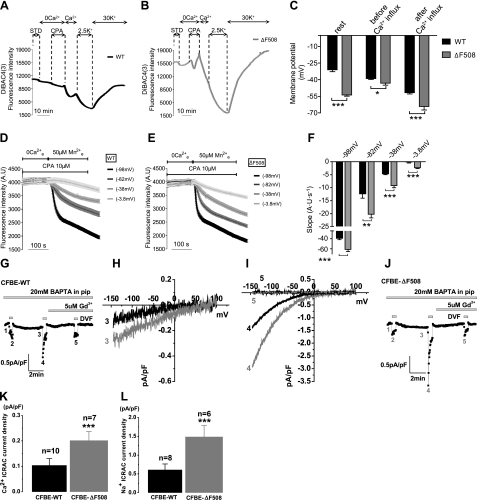
Figure 5.
Increased Orai1-mediated current in CFBE-ΔF508 cells is not through changes in the membrane potential. A, B) Time courses of the MP during the SOCE in CFBE-WT (A) and -ΔF508 cells (B). Traces are means ± se of 21 and 15 cells in CFBE-WT and -ΔF508, respectively. C) Summary of the MP at rest, after CPA-induced store depletion (before the influx was triggered) and after the addition of Ca2+ back to the extracellular medium. Results are from 57 and 54 CFBE-WT (black bars) and -ΔF508 cells (gray bars), respectively. Store depletion nearly abolished differences in the MP between CFBE-WT and -ΔF508 cells under CTL conditions. D, E) Representative traces showing Mn2+ quenching rate when the membrane potential was measured and clamped at −98, −82, −38, and −3.8 mV during SOCE by elevating extracellular potassium in CFBE-WT (D) and −ΔF508 cells (E). F) Summary of the quench rates estimated during the first 20 s after Mn2+ addition in CFBE-WT (black bars) and -ΔF508 cells (gray bars). Note that Mn2+ entry into CFBE-ΔF508 cells was significantly faster at all membrane potentials studied. Data are means ± se of ∼30 cells for all conditions. G–L) CFBE-ΔF508 cells show larger CRAC current (ICRAC) compared to CFBE-WT cells. G, J) CFBE-WT (G) and -ΔF508 cells (J) were dialyzed with a pipette solution containing 20 mM BAPTA to induce store depletion, and whole-cell currents were measured in the presence of 20 mM Ca2+e and after applying pulses of DVF bath solutions to amplify CRAC currents. Currents recorded in DVF solutions show the typical depotentiation reminiscent of Na+ CRAC currents. Low concentrations of lanthanides (5 μM Gd3+) shown to inhibit Orai1-mediated CRAC currents were used at the end of the recordings. Data points from each ramp were taken at −100 mV and plotted. Small inwardly rectifying ICRAC currents developed in both cell types and were greatly amplified under DVF conditions. H) The I/V relationships show larger Ca2+ ICRAC in CFBE-ΔF508 cells than in -WT cells. I). Similarly, the I/V relationships measured in DVF solutions show larger Na+ ICRAC in CFBE-ΔF508 than in -WT cells, which are completely blocked by 5 μM Gd3+. In all sweeps represented in panels H and I, leak currents were subtracted. K, L) Data summary of Ca2+ ICRAC density in CFBE-WT (n=10) and -ΔF508 (n=7) cells (K) and of monovalent ICRAC density in CFBE-WT (n=8) and -ΔF508 (n=6) cells (L).

