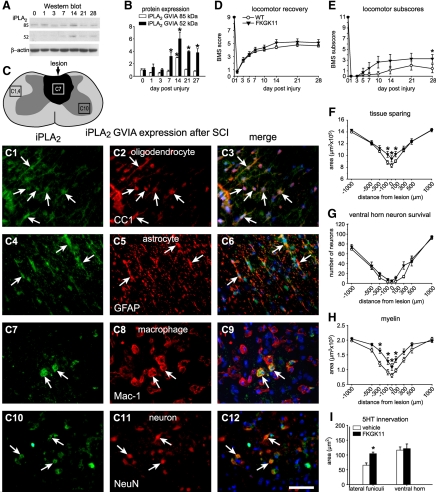
Figure 4.
A) Western blot showing iPLA2 GVIA protein expression after SCI. The activated form (52 kDa) is detected from 7 to 28 dpi. B) Quantification of iPLA2 GVIA protein levels from 1 to 28 d after SCI by Western blotting (n=3/time point). The 84-kDa form is significantly increased at 14 dpi. The cleaved form of iPLA2 (∼50 kDa) is significantly increased from 7 to 28 d after SCI, peaking at 14 dpi. C) Line drawing of the contused spinal cord shows the lesion in dark shade. The 3 areas outlined by the rectangles indicate regions from which the micrographs in panels C1–C12 were obtained. Panels illustrate double immunofluorescence images showing colabeling (arrows) of iPLA2 GVIA (green; C1, C4, C7, C10) with anti-CC-1 (oligodendrocytes; C2, C3), anti-GFAP (astrocytes; C5, C6), anti-Mac-1 (microglia/macrophages; C8, C9), and anti-NeuN (neurons; C11, C12). Note that iPLA2 GVIA is mainly expressed in oligodendrocytes but also in some of the other cell types (arrows). D, E) Time course of locomotor recovery evaluated using the BMS (D) and locomotor BMS subscores (E). Treatment with FKGK11 (n=9) results only in significantly better BMS subscores at 28 d after SCI as compared to vehicle-treated mice (n=9; E). These subscores evaluate finer aspects of locomotor control. No differences were seen in the main BMS scores (D). F) Treatment with FKGK11 shows greater tissue sparing at the epicenter and in adjacent areas at 28 d after SCI. G) No differences were seen in the survival of neurons in the ventral horn in mice treated with FKGK11. H) Treatment with FKGK11 results in greater sparing of myelin, assessed by Luxol fast blue staining, in areas adjacent to the lesion epicenter at 28 d after SCI. I) Quantification of serotonergic fibers at 1000 μm caudal to the epicenter at 28 d after SCI. Mice treated with FKGK11 show significantly greater sparing of serotonergic fibers in the lateral funiculi. Scale bar = 50 μm. *P < 0.05.

