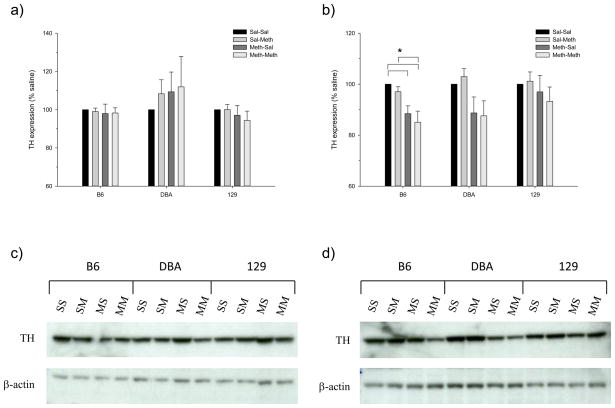
Figure 5.
Effects of Meth treatment on TH expression in the striatum of (a) adolescent and (b) adult mice. Significant differences between treatment groups (within genotype) are indicated with a bar and an asterisk (p<0.05; Tukey’s). Representative blots of TH immuneoreactivity are shown for (c) adolescents and (d) adults (SS=Sal-Sal; SM=Sal-Meth; MS=Meth-Sal; MM=Meth-Meth).

