
Figure 4.
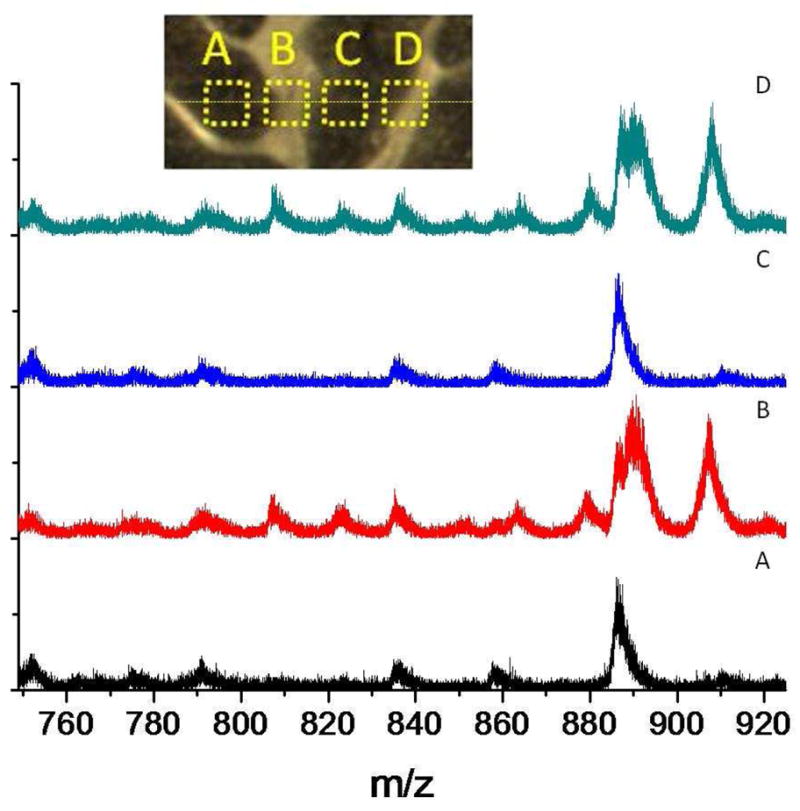
Representative 520 keV Au400+4 ToF-SIMS negative ion mode spectra from a line scan A-D across the cerebellum region (top inset, boxes not to scale) of the box highlighted in Fig 3a. All spectra correspond to a 100×100 μm2 field of view and 106 impacts.