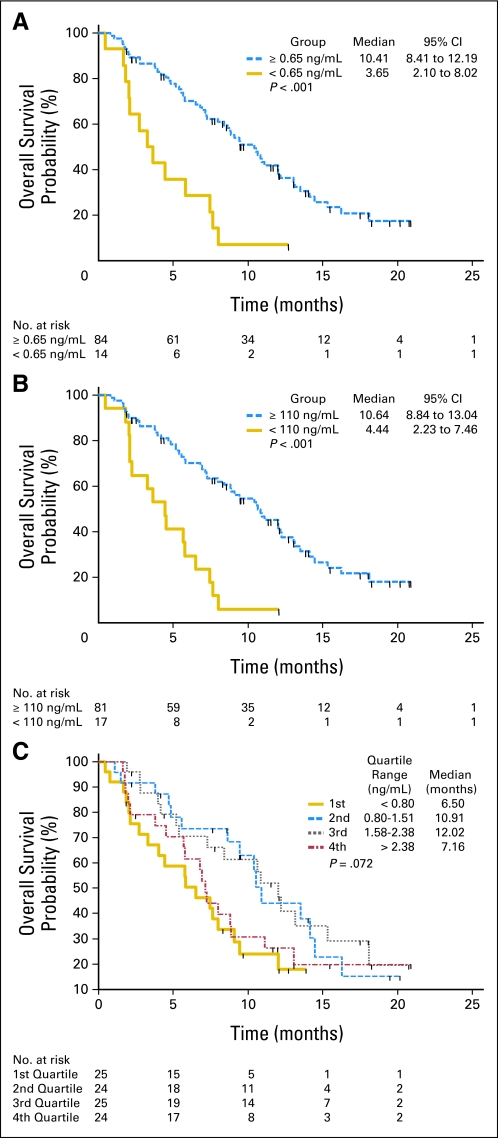
Fig 3.
Association of free and total insulin-like growth factor (IGF) with patient survival. (A) Kaplan-Meier plots for overall survival (OS) of patients with a baseline (cycle 1 day predose) free IGF-1 lower than 0.65 ng/mL (n = 14) versus ≥ 0.65 ng/mL (n = 84). (B) Kaplan-Meier plots for OS of patients with a baseline total IGF-1 lower than 110 ng/mL (n = 17) versus ≥ 110 ng/mL (n = 81). (C) Kaplan-Meier plots for OS by quartile of baseline (cycle 1 day predose) free IGF-1 levels.

