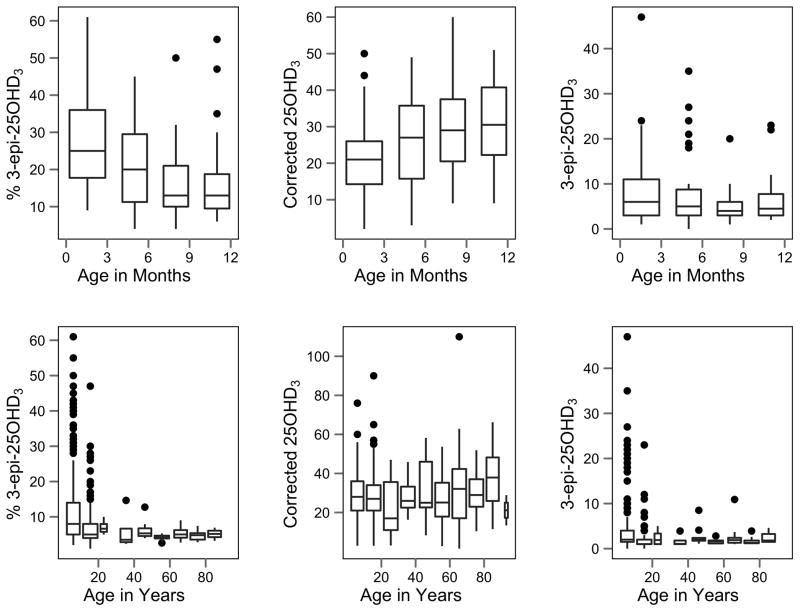
Figure 1. Distribution of 25(OH)D forms across age groups for 125 infants ranging from birth to 12 months and 624 patients ranging from 1–94 y.
(Top) In the infant population, no statistically significant trend was present for 3-epi-25(OH)D3; however, a significant negative trend for % 3-epi-25(OH)D3 (τ = −0.28, p < 0.001) and a significant positive trend for 25(OH)D3 (τ = −0.27, p = 0.003) were observed. (Bottom) For patients aged 1–94 y, no statistically significant trend was present for corrected 25(OH)D3; however, a significant negative trend was observed for 3-epi-25(OH)D3 (τ = −0.20, p < 0.001) and % 3-epi-25(OH)D3 (τ = −0.27, p < 0.001). Units for 25(OH)D3 and 3-epi-25(OH)D3 are nmol/l.

