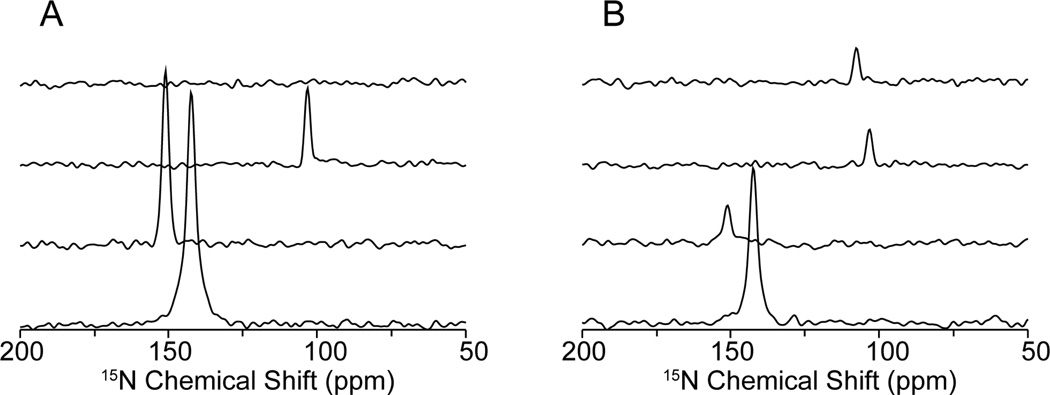
Figure 4.
One-dimensional spectral slices along the 15N chemical shift dimension taken from the two-dimensional spectra shown in Figure 3. A. 15N/13C HETCOR. B. 15N/13C HETCOR with 1H-irradiation at 40 kHz. From top to bottom, the slices correspond to pairs 1 to 4, respectively. In Figure 4A, the measured signal-to-noise ratios are 36 (pair 2), 83 (pair 3) and 111 (pairs 4). In Figure 4B, the measured signal-to-noise ratios are 17 (pair 1), 18 (pair 2), 18 (pair 3) and 74 (pair 4). Reductions in some signal intensities result from competing pathways. The narrow single-line peaks and the flat baselines indicate that the transfer from 15N to 13C is selective.

