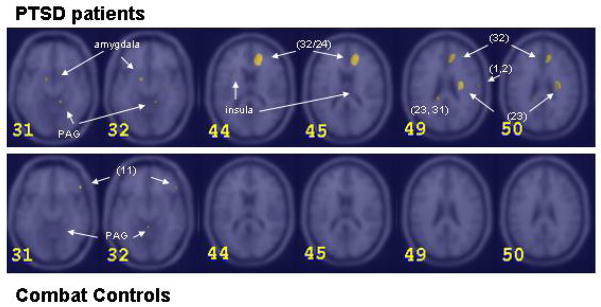
Figure 2.
Areas of increased blood flow in diesel and PTSD patients (top row) and combat controls (bottom row) in different horizontal sections through the brain (slice 31 and 32: z= −12; slice 44 and 45: z=6; slice 49 and 50: z=26). Brain sections were chosen to illustrate the relevant activations. Between brackets are Brodman areas. PAG= periaquaductal grey. (Z Score >3.09, p<0.001)

