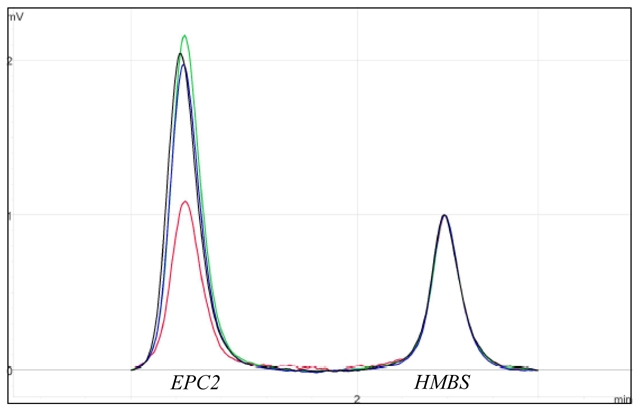
Figure 3. Multiplex PCR/Liquid chromatography validation experiment, patient 1.

The electrophoregrams of the patient (in red) and of the parents (mother in green, father in blue) were superimposed to those of controls (in black) and normalized on HMBS2 internal control peak (148 bp) intensity. The presence of a deletion was indicated by a twofold reduction in the height of the exon 7 EPC2 amplicon peak (112 bp).
