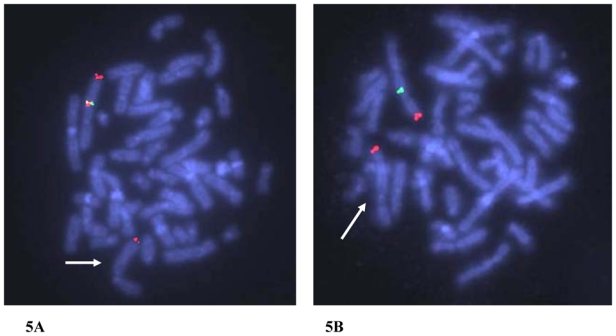
Figure 5. FISH analysis of patient 2.

(5A) Fluorescent hybridisation with BAC clones RP11-341F20 (green) and RP11-548K13 (red) associated to a 2qter specific probe as a control (red) shows absence of signal on the derivative chromosome 2 in subject 2, indicated with an arrow (10 metaphases and 25 interphase nuclei examinated).
(5B) Fluorescent hybridisation with BAC clone RP11-659J19 (green) and 2qter specific probe as a control (red) shows absence of green signal on the derivative chromosome 2 in subject 2, indicated with an arrow (10 metaphases and 25 interphase nuclei examinated).
