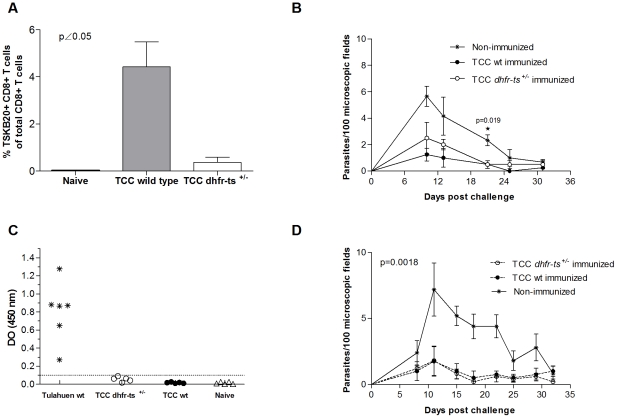
Figure 5. Short term protection in immunocompetent mice infected with TCC mutant parasites.
(A) Lymphocytes were recovered from blood of B6 mice immunized with TCC wild type (grey bar) and TCC dhfr-ts+/− (white bar) 14 days after the boost and were stained with the TSKB20 MHC I tetramer. Bars represent the mean frequencies of CD8+ tetramer-positive lymphocytes for four mice per group; error bars represent standard errors of the mean. (B) Parasitemia curve of B6 mice infected with 5×10⁵ TCC dhfr-ts+/− metacyclic trypomastigotes, TCC wild type metacyclic trypomastigotes and PBS and challenge with 104 virulent CL parasites. (C) Dispersion diagrams of antibody levels in either naive animals (non immunized) and those immunized with 5×10⁵ metacyclic trypomastigotes of TCC dhfr-ts+/− or TCC wild type. The results are expressed as the ratio of the absorbance of each serum sample at a 490-nm optical density (OD) to the cutoff value. Dotted lines indicate the cutoff adopted for positivity, calculated as the mean of the values determined for the naive controls plus three times the standard deviation. Positive controls were infected with Tulahuen wild type parasites. (D) Parasitemia curve of Balb/c mice infected with TCC dhfr-ts+/− metacyclic trypomastigotes, TCC wild type metacyclic trypomastigotes or PBS and challenge with 5×10³ virulent Tulahuen blood trypomastigotes. Values are given as means; error bars indicate standard errors of the mean.

