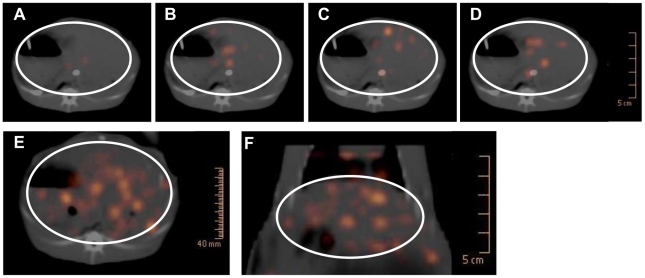
Figure 4. PET-CT images of photons emitted from 18F-FDG-labeled CsNEJs in the rabbit liver.
Photon images represent Clonorchis sinensis arriving at the intrahepatic bile ducts of the rabbit liver. A–D, dynamic images at 7–9, 16–18, 22–24. and 52–54 minutes after CsNEJs inoculation. Static axial (E) and coronal (F) images taken 90 minutes after the CsNEJs inoculation. The liver is located as a region of interest (circle).

