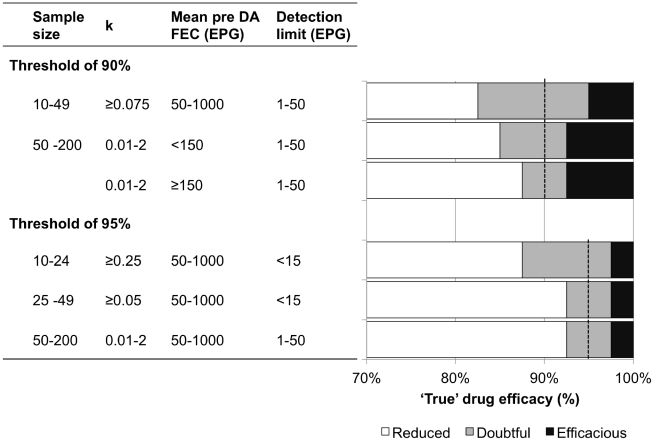
Figure 3. The detection of reduced efficacy when defined as ‘true’ drug efficacy <90% and <95%.
Only combinations of sample size (n), mean fecal egg count before drug administration (mean pre-DA FEC), detection limit and aggregation (k), which resulted in a reliable FECRT (sensitivity (Se) and specificity (Sp) ≥85%) are shown. Also shown are TDE limits for Se and Sp, which caused Se and Sp <85%.

