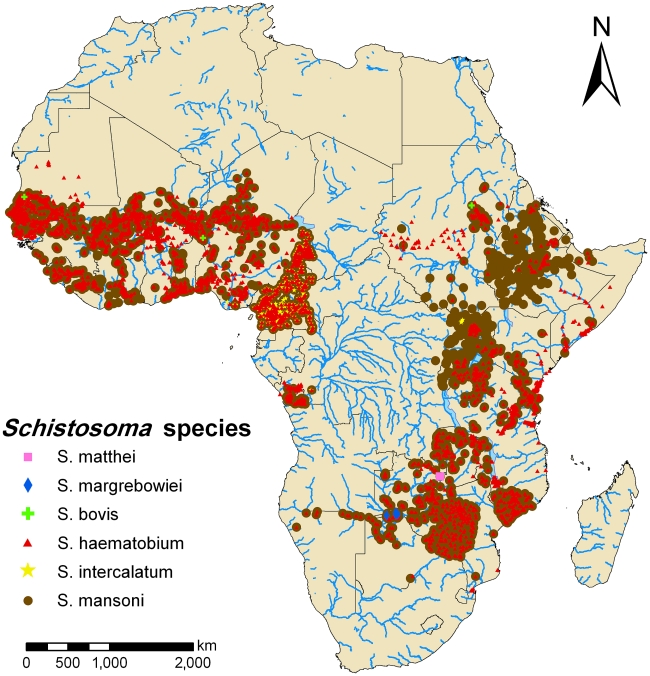
Figure 2. African map of schistosomiasis survey locations based on current progress of the GNTD database.
Survey locations are represented by pink squares for S. matthei, blue diamonds for S. margrebowiei, yellow stars for S. intercalatum, green crosses for S. bovis, brown dots for S. mansoni and red triangles for S. haematobium. Surveys where subjects were screened for co-occurrence of multiple species are indicated with overlapping symbols.

