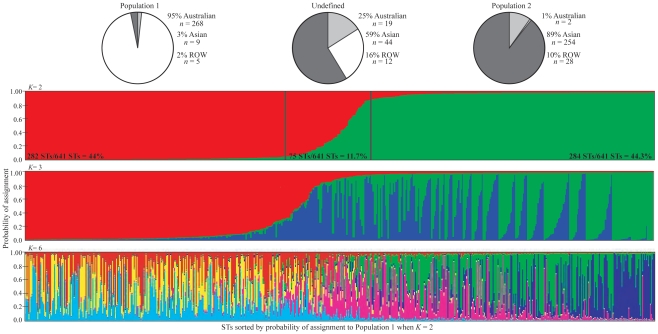
Figure 1. Estimated population assignments of B. pseudomallei genotypes based on multilocus sequence typing data and Structure.
Each thin vertical line represents one sequence type (ST) and is divided into K portions (based on color) that represent the likelihood of assignment into K populations. STs are sorted by probability of assignment into Population 1 (predominantly Australian STs) when K = 2. Two black vertical lines show thresholds of 95% probability of assignment. We considered STs with assignment probabilities below these thresholds to be “undefined”. The pie charts indicate the geographical sources of STs that comprise each group. Rest-of-the-world (ROW, shown in light grey) is composed of STs that were isolated from regions other than Australia (illustrated as the white slice) or Southeast Asia (shown as the dark grey slice) according to the public MLST database (http://bpseudomallei.mlst.net/).

