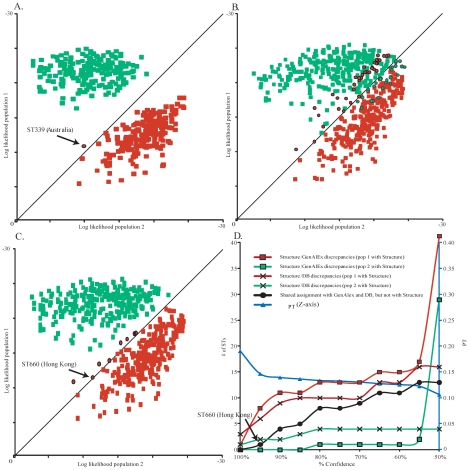
Figure 3. Population assignments of STs using GenAlEx and assignment discrepancies with Structure.
Charts (A–C) represent the log likelihood of assignment of each ST by GenAlEx. A priori population designations were made with Structure and those STs assigned to a population in 100% of iterations (A), ≥95% of iterations (B), and ≥50% of iterations (C). STs with a priori designation as Population 1 are shown in red while those designated as from Population 2 are shown in green. STs with a log likelihood of assignment as calculated by GenAlEx that was in disagreement with Structure assignments are outlined in black. See text for a discussion on ST339 and ST660 indicated in A and C. (D) The relationship between % confidence and discrepancies between Structure and GenAlEx, between Structure results and published origin in the MLST database, and with the estimate of the population genetic differentiation (ΦPT).

