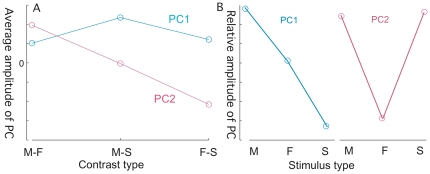
Figure 4. Pattern of Activity for the Principal Components.
4a. The average values within the ROI for the two major PC images. 4b. Relative values of PC derived from Fig. 4a, showing the relationship between the fMRI activity and the stimulus type. Only the pattern across stimulus types with in each PC is relevant.

