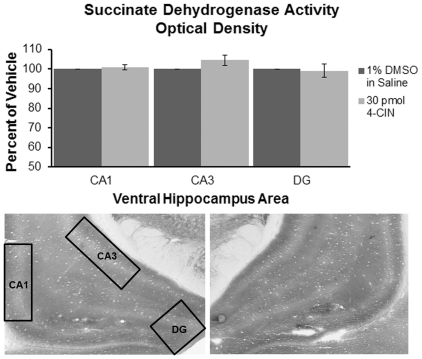
Figure 7. Representative histology showing SDH activity in the ventral hippocampus.
In this example, the left hemisphere received infusions of 1% DMSO in saline (left) and the right hemisphere received infusions of 30 pmol 4-CIN. There were no significant differences in optical density between ventral hippocampal areas receiving 30 pmol of 4-CIN or 1% DMSO in saline in CA1, CA3, or dentate gyrus (n = 6; p>0.1).

