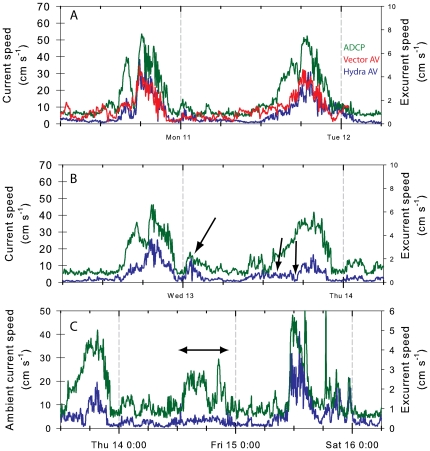
Figure 3. In situ time series of velocity: an expanded portion of the in situ time series shown in figure 2A .
The green line is the ambient current speed (ADCP) and red and blue lines are the excurrent velocity of the two sponges (Vector and Hydra respectively), one facing into the flood flow (red) and one protected on the lee side of a dense sponge thicket. For most of the time the excurrent velocities of both sponges were correlated with ambient current speed (A). At times however, the excurrent velocity of a sponge reduced to near zero (B, arrows), and remained low for long periods (C, double headed arrow) despite high ambient current speed.

