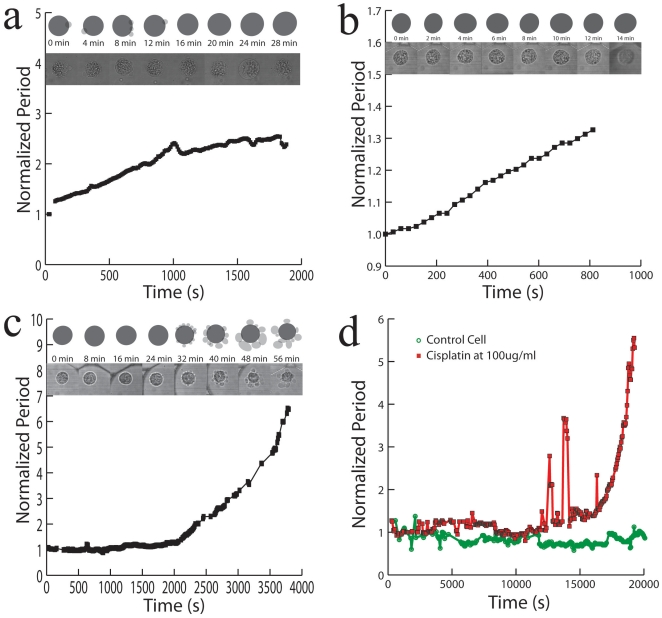
Figure 3. Changes in the rotation period of a single HeLa cell.
a) In DMEM on an agarose layer b) In a mixture of 75% DI water and 25% DMEM c) In a mixture of DMEM with 5% Ethanol and d) for a live cell in DMEM (green circles) compared to a HeLa cell (red squares) in DMEM with a 100 ug/ml of Cisplatin. The Y axis is the normalized period, and the X axis is time in seconds. Lines show trend between connected points. For each graph, in the pictures above it, the bottom pictures show snapshots of the rotated cell at each indicated time, while the schematic pictures on top of it show the corresponding cell shapes (fixated cell not shown). Dark discs represent the cell cytoplasm and membrane, while grey spots show the vesicles formed at the surface, if any.

