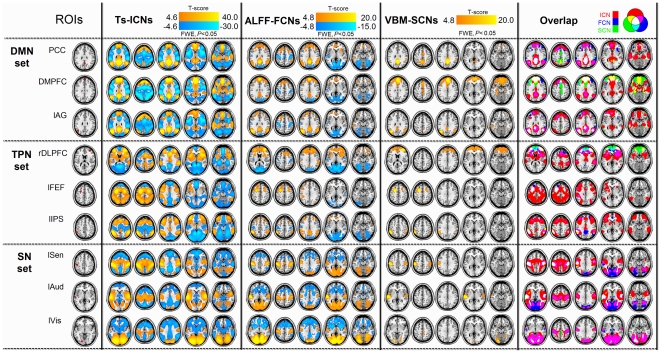
Figure 1. Brain network pattern mapped by ALFF-FCN, TS-ICN and VBM-SCN techniques.
All ALFF-FCNs, TS-ICNs and VBM-SCNs showed significantly positive correlation (warm color). Networks from each ROI presented autocorrelation and contralateral homotopic regions, and largely overlapped across the three network approaches. The ALFF-FCNs and TS-ICNs had wider lateral distributions than VBM-SCNs. Both the ALFF-FCN and TS-ICN measures, but not the VBM-SCN measure, yielded significantly negative correlation networks (cold color).

