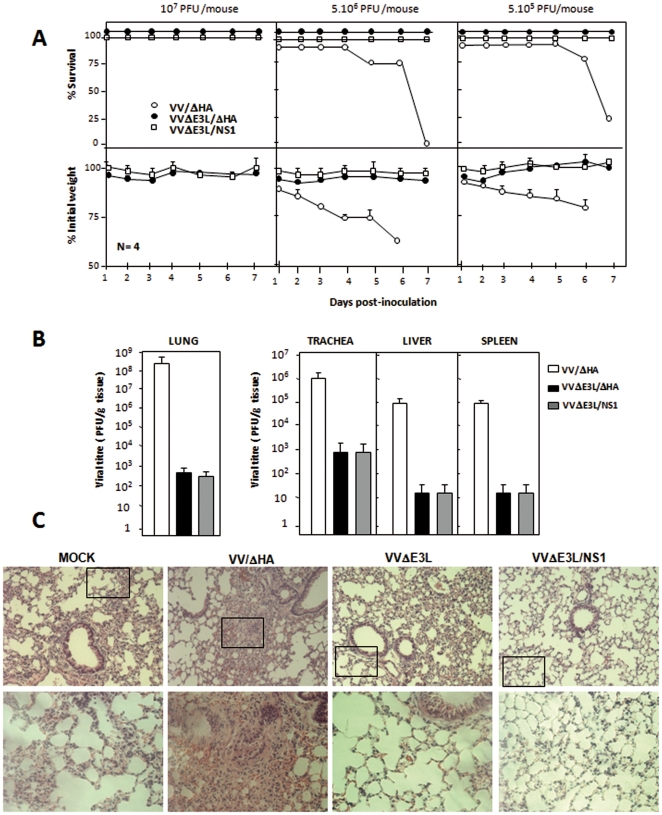
Figure 4. The expression of influenza virus NS1 protein does not modify the attenuated phenotype of VVΔE3L in vivo.
A. C57/BL6 mice were infected i.n. with three doses of VVΔE3L/ΔHA or VVΔE3L/NS1, (107, 5×10⁶ or 5×10⁵ PFU/mouse) and two doses of VV/ΔHA (5×10⁶ or 5×10⁵ PFU/mouse). Weight and survival rates were monitored. Survival curves are shown in the upper panels. The percentage of weight loss of each animal with respect to the initial weight at the starting of the experiment was calculated, and the mean values of four animals per group are represented (lower panels). The error bars represent standard deviation. B. Quantitative analysis of viral replication in the lung, trachea, liver, and spleen of VV/ΔHA, VVΔE3L/ΔHA or VVΔE3L/NS1 infected mice (5×10⁶ PFU/mouse) at 3 days p.i. The yields of infectious virus in the different tissues from four animals per group were determined by plaque assay for VV/ΔHA and VVΔE3L/NS1 or by immunostaining for VVΔE3L/ΔHA. The results represent the mean values of 3 independent experiments ± standard deviation. P values from a two-tailed t test assuming non-equal variance were determined. In all the cases we obtained P<0.01. C. Hematoxylin and eosin staining of histological sections of lung tissues from C57/BL6 mice mock-infected or infected i.n. with 5×10⁶ PFU/mouse of VV/ΔHA, VVΔE3L/ΔHA or VVΔE3L/NS1 at 3 days p.i. Upper panels show representative fields, and lower panels represent enlarged areas of fields shown in the upper panels (indicated by the square). Three different biological samples were analyzed.

