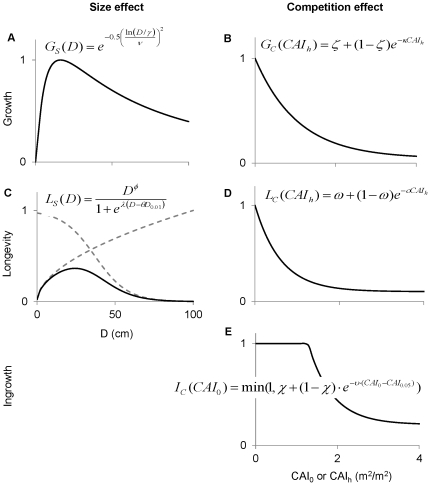
Figure 1. Equations and graphs illustrating the effect of tree size and competition on demographic rates.
The equations relate diameter growth (top panels: A,B), longevity (middle panels: C,D), and ingrowth (bottom panel: E) to tree diameter (D; left panels: A,C) and crown area index (CAIh and CAI0; right panels: B, D). The effect of diameter on longevity (LS(D), middle left) is specified as the product of an increasing power function and a decreasing logistic function (grey dashed lines). To aid with model fitting, we reparameterized the slope (λ) of the logistic function so that it takes a value of 0.01 at diameter D0.01, and the inflection point is expressed as a proportion (θ) of D0.01, using the relationship λ = ln(99)/(D0.01·(1−θ)). Ingrowth is capped at the maximum rate when crown area index is lower than CAI0.05, the lowest 5th percentile of observed CAI0 values in plots where the species is present. Including this 5th-percentile cap avoids overestimating recruitment in open stands, for which there were few observations. All functional forms were plotted using parameter values for sugar maple (Table 1).

