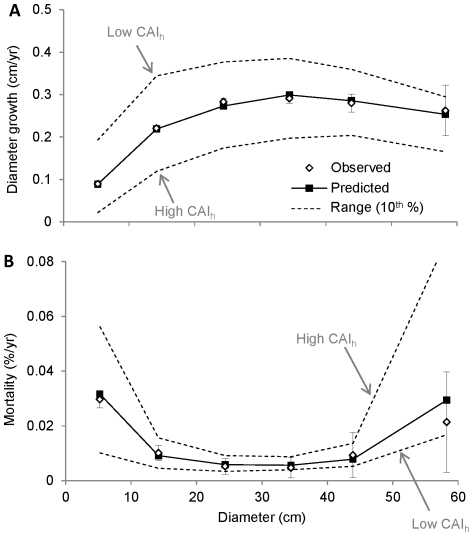
Figure 2. Size dependence of growth and mortality.
The growth (A) and mortality (B) data were sorted into six diameter bins (<10, 10–20, 20–30, 30–40, 40–50, >50) and the mean growth and mortality was calculated for each bin. Error bars show ±2 s.e. for observed growth and mortality. For each bin, the predicted range (dashed lines) was calculated by ranking each tree by CAIh, then calculating the average predicted growth and mortality for the top and bottom ten percent of values.

