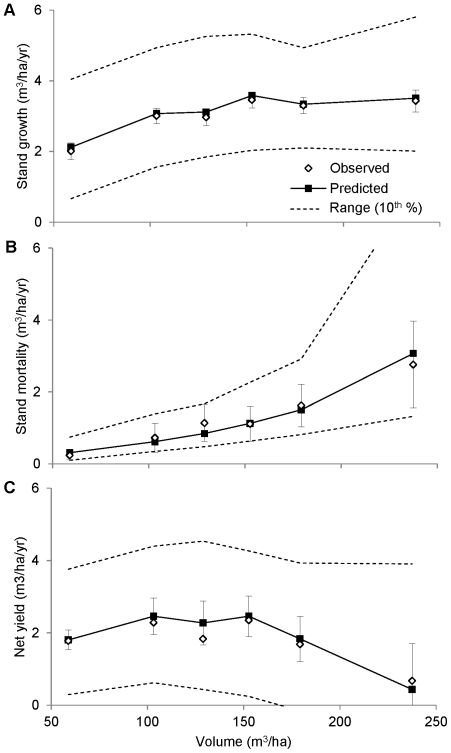
Figure 4. Growth, mortality, and yield of inventoried stands in relation to stand volume.
The growth (A), mortality (B) and yield (C) data were binned and averaged as in Figure 1, but in this case the bin widths were chosen to obtain an equal number of observations in each bin. Error bars show ±2 s.e. for observed stand growth, stand mortality, and net yield. For each bin, the predicted range (dashed lines) was calculated by ranking each plot by the predicted rate, then calculating the average rate for top and bottom ten percent of values. Stands with trees >75 cm in diameter (n = 12) were excluded because of an overwhelming influence of very large trees on stand volume.

