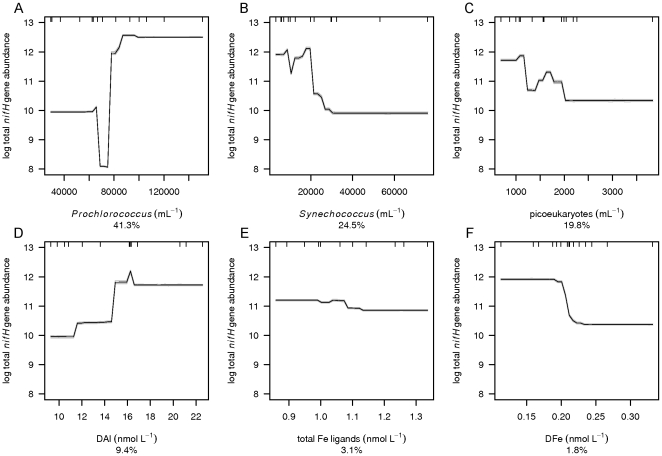
Figure 5. Mean partial dependence plots for the environmental variables describing the total nifH gene abundance.
The partial dependence plots with 95% confidence intervals (light grey, based on bootstrapping of 30 BRT runs and indicating robustness of model performance) for the 6 environmental variables best at explaining the variation in total nifH gene abundance (the sum of Group A, gamma A and filamentous nifH genes). The 6 environmental variables are A) Prochlorococcus, B) Synechococcus, C) picoeukaryotes, D) DAl, E) total Fe ligands and F) DFe. The y-axis is centered to have zero mean over the log distribution of the fitted total nifH gene abundance. A common scale is used for the x-axis. Rug plots at inside top of plots show the distribution of sites across that variable, in deciles.

