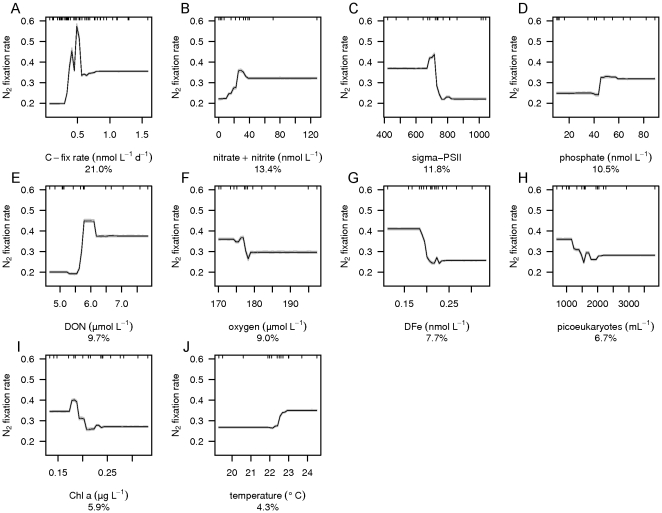
Figure 8. Mean partial dependence plots for the environmental variables describing the N2 fixation rates.
Mean partial dependence plots with 95% confidence intervals (light grey, based on bootstrapping of 30 BRT runs and indicating robustness of model performance) for the 10 environmental variables which explain the variation in N2 fixation rates best. The environmental variables are A) C-fix rate, B) phosphate, C) nitrate + nitrite, D) sigma-PSII, E) DON, F) oxygen, G) DFe, H) picoeukaryotes, I) Chl a, and J) temperature. The y-axis is centered to have zero mean over the distribution of fitted N2 fixation rates. A common scale is used for the x-axis. Rug plots at inside top of plots show the distribution of sites across that variable, in deciles.

