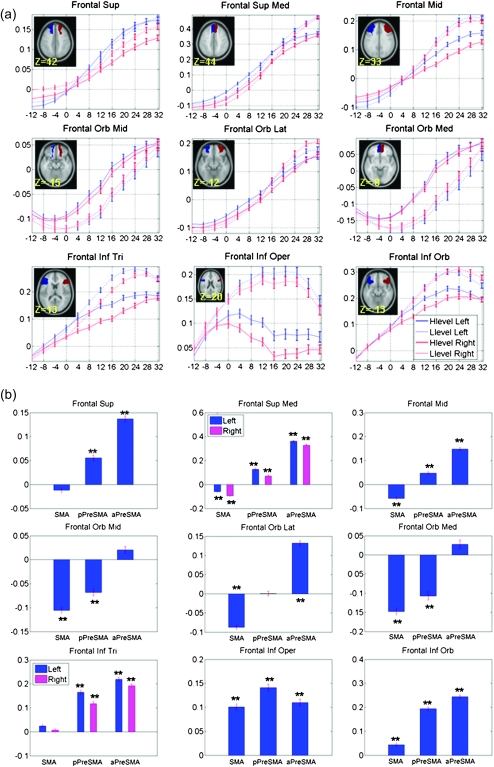
Figure 3.
(a) Correlation z (mean ± standard error; n = 225) scores between each seed region and 9 prefrontal masks (frontal sup: superior frontal gyrus; front sup med: medial superior frontal gyrus; frontal orb mid: middle part of orbital frontal gyrus; frontal mid: middle frontal gyrus; frontal orb lat: lateral part of orbital frontal gyrus; frontal orb med: medial part of orbital frontal gyrus; frontal inf oper: opercular part of IFG; frontal inf tri: triangular part of IFG; frontal inf orb: orbital part of IFG). The x-axis represents the y coordinate of the center of each seed. Correlations are shown in red and blue, respectively, for right- and left-hemispheric seeds, with solid and dashed lines indicating high- and low-level seeds. (b) Correlation z scores averaged across seed regions comprising SMA, posterior preSMA (pPreSMA), and anterior preSMA (aPreSMA). The results are shown separately for left- and right-hemispheric masks if differences exist (ANOVA, Table 2). Correlation z scores that were significant different from zero were highlighted with **P < 0.0001, uncorrected (for details, see Supplementary Table 1).

