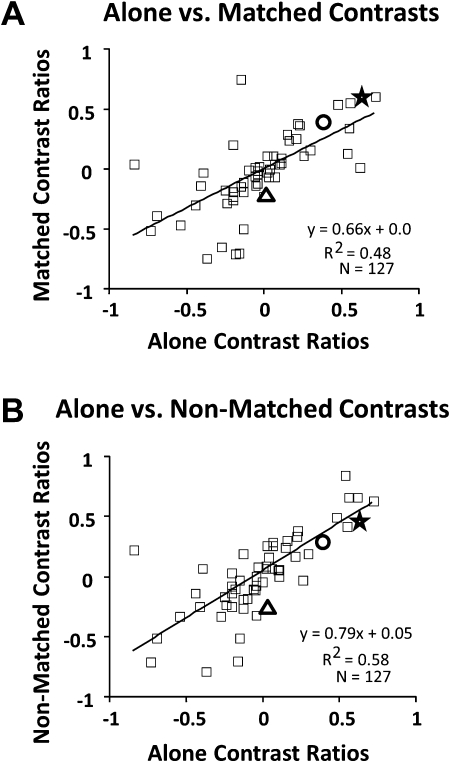
Figure 6.
Comparisons between responses evoked during driving by optic flow and object motion across stimulus conditions. Each scatter plot shows a data point for each neuron, the points representing the contrast ratios for driving by optic flow minus driving by object motion, divided by the sum of those values. The neurons illustrated in the preceding figures are indicated as: Figure 3, star; Figure 4, triangle; Figure 5, circle. (A) Plot of the contrast ratios to each stimulus presented alone (abscissa) versus the matched heading combined stimuli (ordinate) showing that most neurons maintain similar selectivities under both conditions. (B). Plot of the contrast ratios to each stimulus presented alone (abscissa) versus the nonmatched heading combined stimuli (ordinate) again showing that most neurons maintain similar selectivities under both conditions. In both cases, but more clearly with nonmatched combinations, there is less variability among optic flow preferring neurons (positive ratios) than among object motion preferring neurons (negative ratios).

