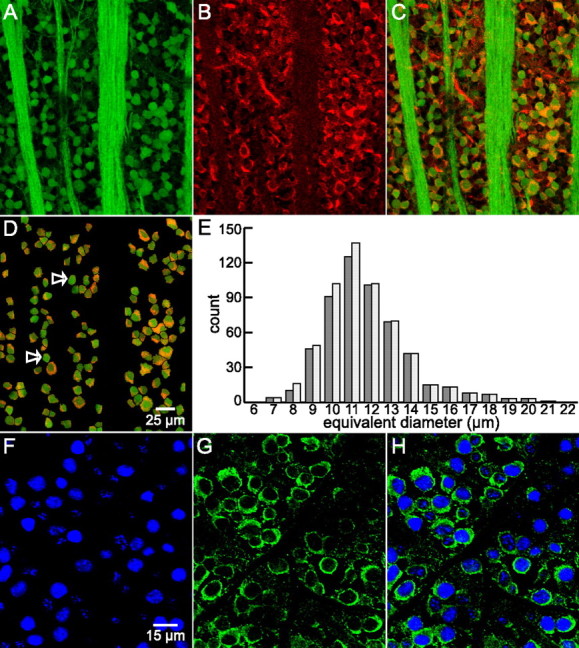
Figure 3.

D1a receptor-like immunoreactivity in ganglion cells in flat-mounted retina. A, As in Figure 2, ganglion cell somata identified by retrogradely transported, fluorescein-coupled dextran (green in A, C, D). The same fluorescence identifies fibers in this image as intraretinal segments of ganglion cell axons, extending as fascicles between the top and bottom edges of A and C. B, Binding of polyclonal (Millipore Bioscience Research Reagents) anti-D1a receptor antibody visualized with Alexa Fluor 568-conjugated secondary antibody. C, Overlay of A and B. As in Figure 2, yellow/orange indicates regions of overlapping red (Alexa Fluor 568) and green (fluorescein) signal, signifying D1a receptor-like immunoreactivity in ganglion cells. D, Same field as C masked to highlight dextran-containing somata only. The arrows show some ganglion cells without noticeable D1a-like immunoreactivity. Fluorescent images A–D are maximum intensity z-projection of five consecutive optical sections obtained at 1 μm z-intervals with three-frame Kalman averaging. Scale bar: (in D) A–D, 25 μm. E, Side-by-side histograms of apparent size of ganglion cells identified by fluorescent dextran incorporation via retrograde transport (light bars) and the subset of these cells that also showed D1a-like receptor immunoreactivity (dark bars). Cells were masked, selected, and analyzed in ImageJ from five fields similar to (and including) D from three different retinas. Each ImageJ-reported cross-sectional area converted to diameter of an equivalent circle. Diameters are placed into 1 μm bins centered about the indicated values. F–H, Binding of an anti-D1a receptor antibody and an antibody directed against ganglion cell marker Brn3a. F and G are sequentially collected single optical sections of the ganglion cell layer of a retina incubated in anti-Brn3a and anti-goat DL549-conjugated secondary, and monoclonal (Novus) anti-D1a primary antibody and anti-mouse DL649-conjugated secondary, respectively. Fluorescence from the fluorophores is pseudocolored blue and green. H merges the images in F and G. The crisp green outline of each blue cell profile shows that the monoclonal anti-D1a antibody binds to many of the somata identified as ganglion cells in this field. Scale bar: (in F) F–H, 15 μm.
