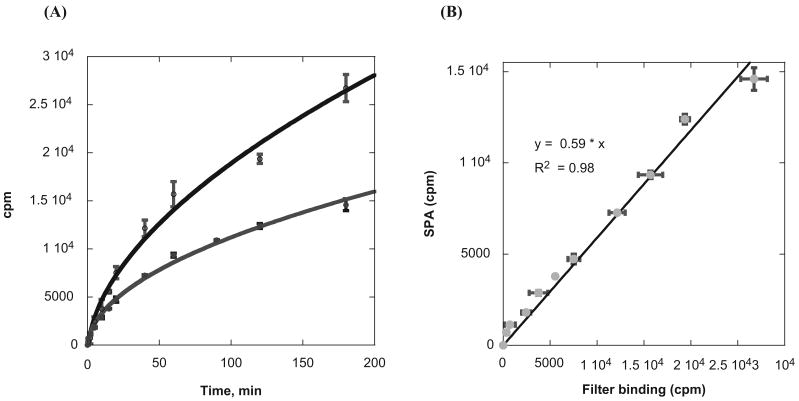
Fig. 2.
Correlation of the scintillation proximity assay (SPA) with the standard filter binding assay. (A) Time course of H4-BTN methylation measured by the SPA (blue) and the filter binding assay (black). The reaction mixture contained 0.8 μM 3H-SAM, 10 nM PRMT1, and 1 μM H4-BTN. In the SPA measurement, 10 μL of 40 mg/mL SPA beads was used. (B) Correlation of the data of the SPA with that of the filter binding assay. The cpm of the filter binding assay is on the x-axis and the cpm of SPA is on the y-axis.

