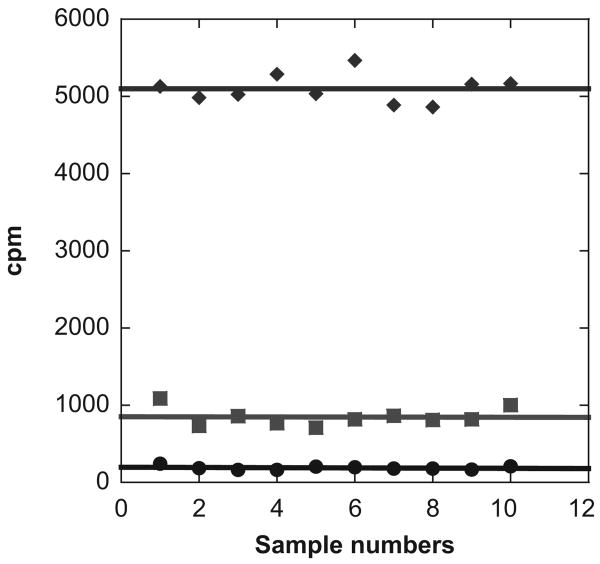
Fig. 4.
A scatter plot of the scintillation proximity assay (SPA) signals displaying the levels of methyltransferase activities of RPMT1 compared with the background signal level. Green line: the positive controls containing 0.9 μM 3H-SAM, 37 nM PRMT1, and 2.5 μM H4-BTN. Black line: the negative controls containing 0.9 μM 3H-SAM and 2.5 μM H4-BTN. Blue line: the inhibitor samples containing 0.9 μM 3H-SAM, 37 nM PRMT1, 2.5 μM H4-BTN, and 3 μM SAH. All reaction samples were incubated for 20 min, and following the reaction, 10 μL of 20 mg/mL SPA beads was added to each sample for scintillation counting.

