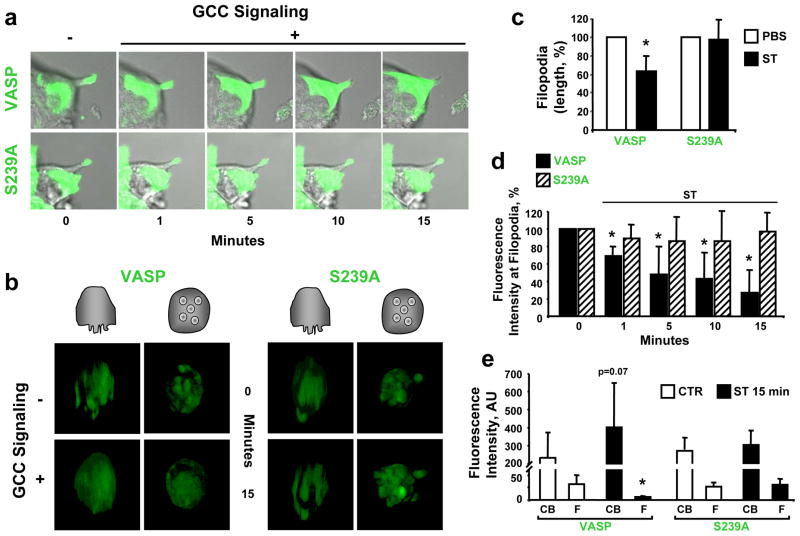
Fig. 5.
VASP Ser239 phosphorylation induces membrane protrusion retraction in colon cancer cells. Fluorescently-tagged VASP constructs, GFP-VASP (VASP) and GFP-VASP-S239A (S239A), were stably expressed in T84 cells as described in Material and Methods. GCC signaling was induced with ST (1 μM), while PBS was the vehicle control. (a) Representative time course of a live cell experiment analyzing filopodial kinetics by confocal microscopy, performed as detailed in Material and Methods. Photographs reflect merged DIC and confocal microscopy images. (b) Representative 3-D projections from live imaging (confocal microscopy) analyzing invadopodia in single tumor cells plated on Matrigel scaffolds. Cartoons on top indicate visual vertical (left panels) and basolateral en face (right panels) perspectives of 3-D reconstructions from Z-stack images. (c) The length of filopodia following treatments for 15 min was quantified as in Fig. 2b and expressed as percentages of respective PBS controls. (d) Quantification of GFP-tagged VASP signals at filopodia tips from experiments shown in a. Results are percentages of respective time 0 (before ST administration) controls. (e) Quantification of GFP-tagged VASP signals in cell bodies (CB) and filopodia (F) before (CTR, time 0 control) and after ST (15 min) treatments, as shown in a. AU, arbitrary units. *, P < 0.05 versus respective control.

