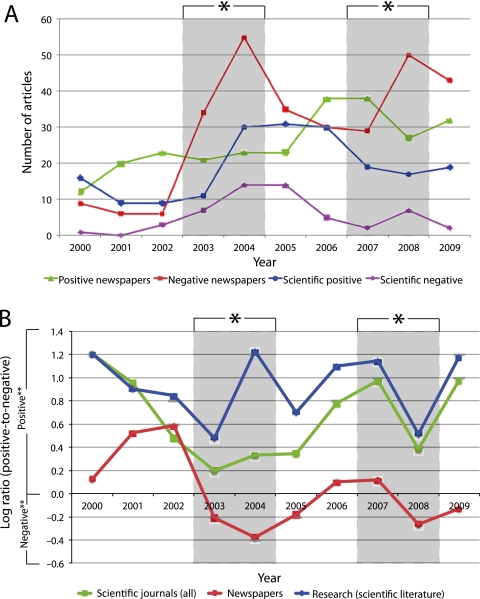
Figure 2.
(A) Effect messages (positive and negative) organised along the research period, per year (2000–2009) and according to the source (scientific–medical journals and newspapers). (B) The natural logarithm of the positive-to-negative ratio was calculated and also plotted for the accumulated scientific–medical articles (green line), accumulated newspaper articles (red line) and solely research articles from the scientific–medical literature (dark blue line). *The grey zone illustrates the period where most of the regulatory warnings were issued. **Articles with a positive-effect trend are located above zero, while articles conveying a negative-effect trend are located underneath zero.

