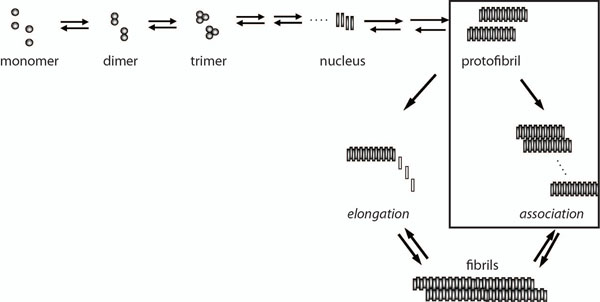
Figure 1.
Kinetics of Aβ aggregation pathway. Schematic representation of the overall Aβ aggregation towards fibril formation indicating significant steps involved. The boxed area, which represents the conversion of protofibrils to fibrils via lateral association, is the reaction that is being investigated in the current work.

