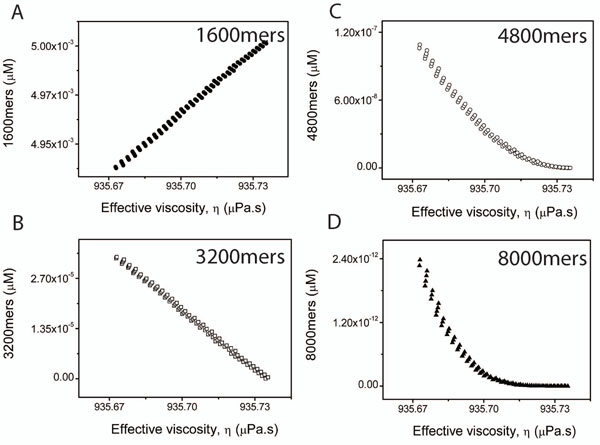
Figure 6.
Variation of effective viscosity with concentration. Figures A,B,C and D show variations in the effective viscosity versus concentration in the 5-species example for 1600-mers, 3200-mers, 4800-mers and 8000-mers respectively. The figure A shows that the effective viscosity is directly proportional to the concentration of the 1600-mers while B,C and D reveal it to be inversely proportional to the respective concentrations.

