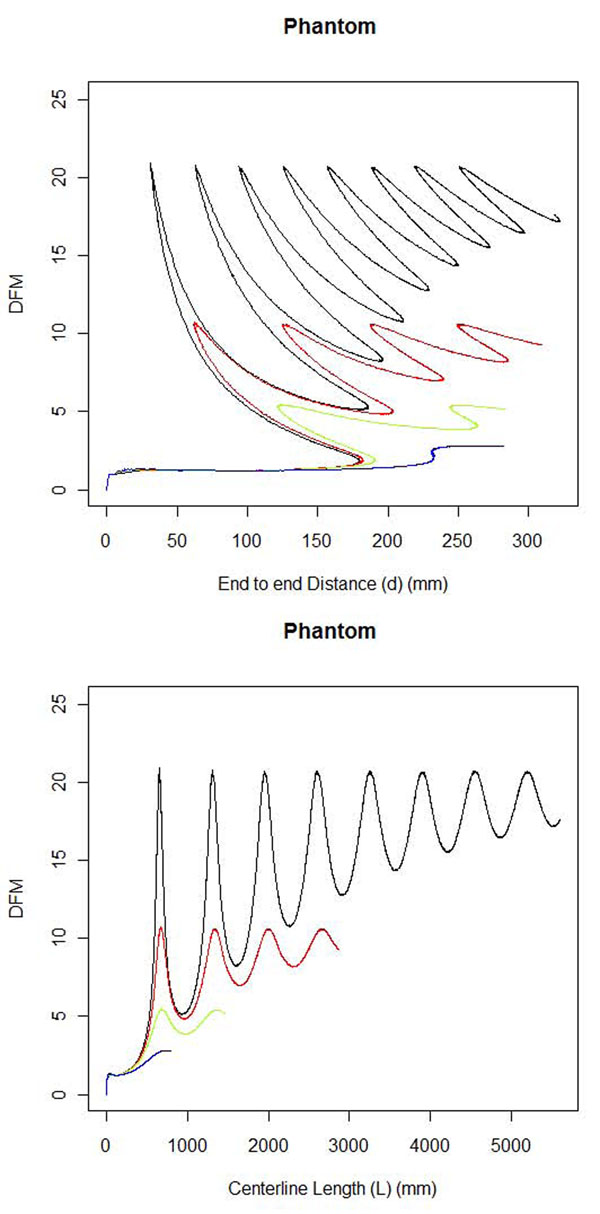
Figure 7.
Phantom tortuosity curves. Helix phantom tortuosity curves are shown in maximum intensity projection. The pitch 5(2π) (black), pitch 10(2π) (red), pitch 20(2π) (green) and pitch 40(2π) (blue) phantoms decrease in tortuosity. (top) DFM tortuosity plotted versus distance d from the start. (bottom) DFM tortuosity plotted versus Length L from the start.

