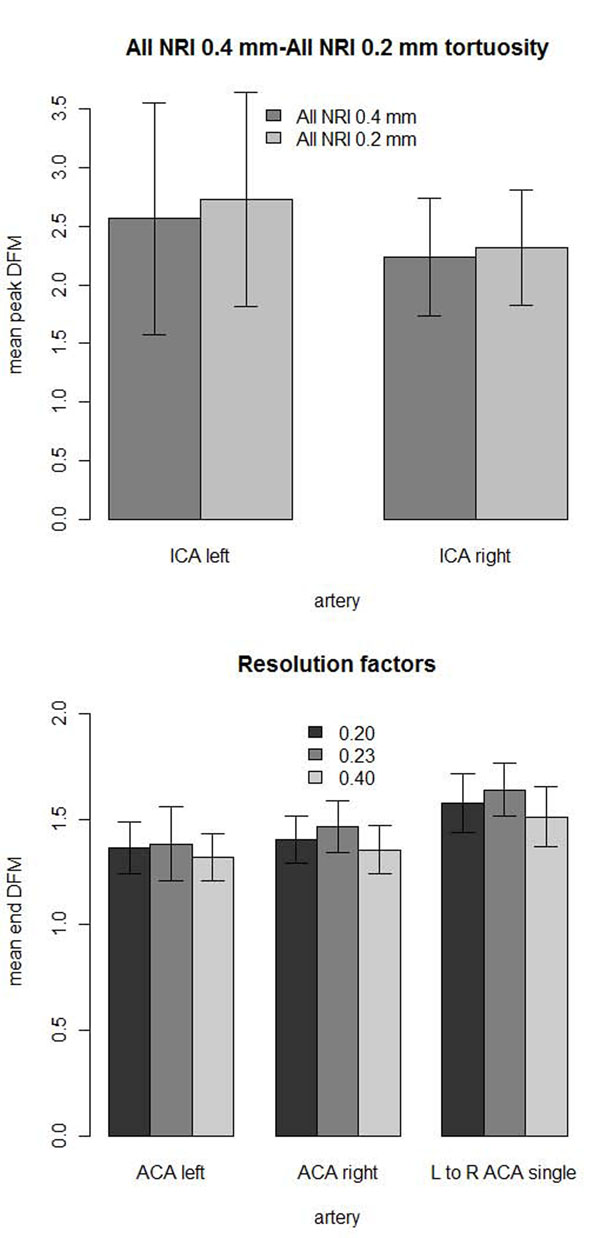
Figure 9.
Tortuosity of resolutions. Comparison of mean tortuosity of the same Korean subjects from NRI with one standard deviation error bars. (top) Left and right ICA tortuosity measurements from higher 0.2x0.2x0.2 mm (0.2 mm) resolutions interpolations of the same images increased compared to 0.4x0.4x0.4 mm (0.4 mm) resolution. (bottom) The mean DFM tortuosity of the 0.2x0.2x0.2 mm (0.2) and 0.23x0.23x0.36 mm (0.23) resolution images were closer together than to the 0.4x0.4x0.4 mm images (0.4).

