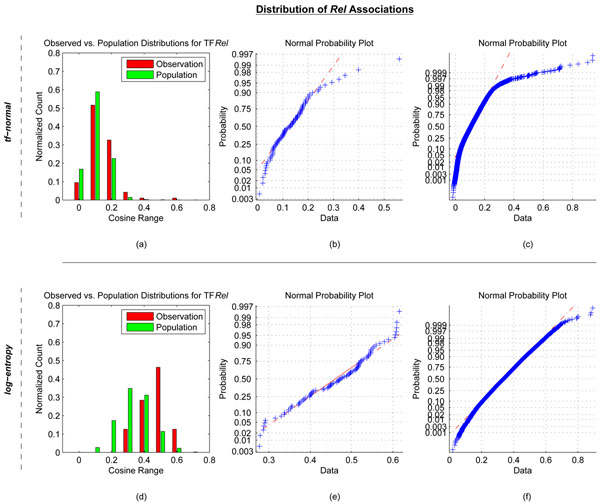
Figure 3.
Distribution of LSI based association scores for TF Rel in the Interferon dataset. Results of the tf-normal (a-c), and log-entropy (d-f) LSI models. (a) and (d) Histograms of cosine distributions of TF Rel with the set of 95 DEGs responding to Interferon stimulation (observed set, red bars) as well as the entire set of 21,027 genes in the mouse genome (excluding Rel) (population set, green bars). (b) and (e) Normality plot of distribution of cosines for the observed Rel associations. (c) and (f) Normality plot of distribution of cosines for all Rel associations.

