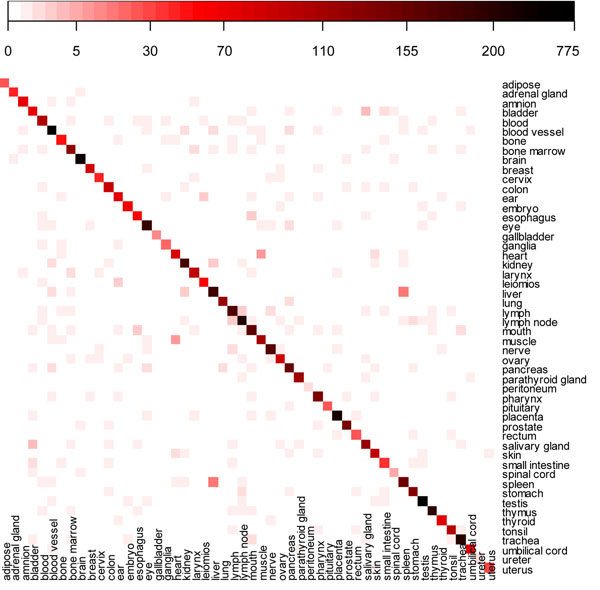
Figure 2.
Heatmap of organ-specific genes among organs. x-axis and y-axis are both 52 organs. The degrees of redness and blackness in each cell represent increase of number of overlapping genes between organs. The legend above the heatmap indicates the range of number of overlapping genes between organs. It is nonlinear color scale from white to red to black, correspondingly, indicating the value scales from 0 to 775.

