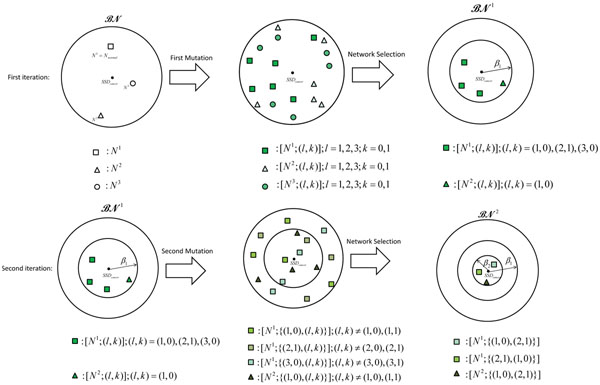
Figure 1.
Illustrative overview of the algorithm. Sequential fault detection algorithm for a family  that consists of three 3-gene Boolean networks (depicted as a square, triangle, or circle). Suppose N1 is the (unknown) normal network that was altered into the cancerous network through M = 2 mutations. In the first row, all possible single mutations are applied to all networks, where the resulting altered networks are shown in the middle. The algorithm keeps only those networks whose residual value (the distance to the cancerous network) is less than β1, resulting in a reduced family
  . In the next step, we consider all possible single gene mutations to the networks in
  , as shown in the middle of second row. The algorithm keeps only those networks whose residual value is less than β2(<β1), which leads to a further reduced set

