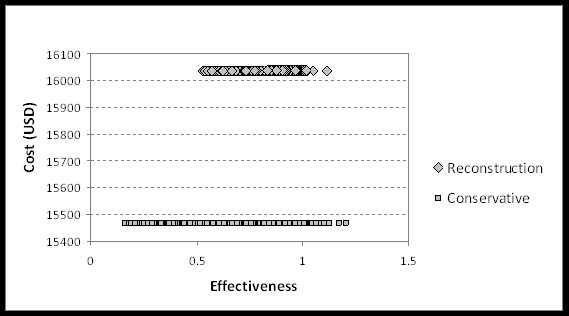
Figure 3.

The cost-effectiveness scatter plot uses the cost-effectiveness plane to plot the cost and effectiveness pair for each recalculation of the model with 10,000 runs for each strategy.

The cost-effectiveness scatter plot uses the cost-effectiveness plane to plot the cost and effectiveness pair for each recalculation of the model with 10,000 runs for each strategy.