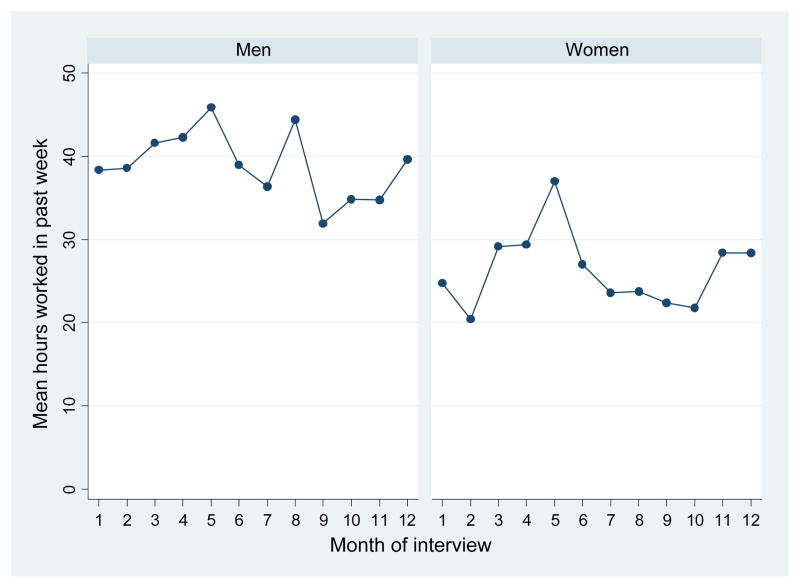
Figure 5. Weekly Hours Worked by Month of Interview (Men and Women in Random Sample).
Notes: Figure is generated using authors’ survey data and shows the average number of hours worked in the past week by men (left panel) and women (right panel) according to the month in which the interview was conducted. The sample used consists of all individuals in the random sample between the ages of 18–65 years.

