
Figure 4.
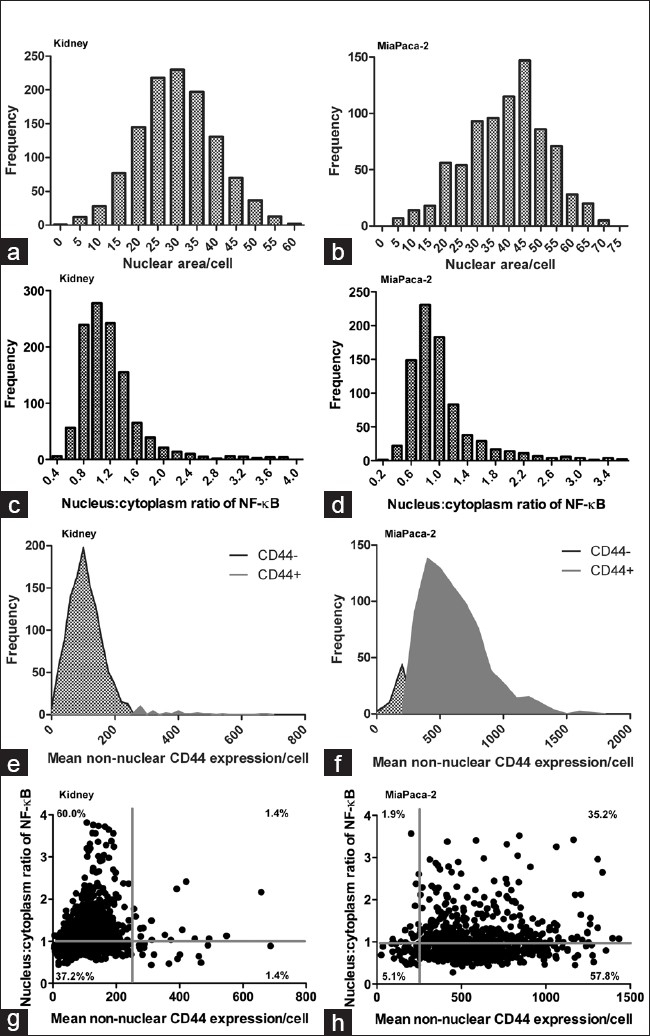
Multiplexed biomarker expression in example tissue and cell line. Multiple measurements were made in the segmented fluorescence digital tissue images. Kidney tissue and MiaPaca-2 cell line were used as example tissue and cancer cell model, respectively. Extracted data were analyzed in Prism 5 (GraphPad Software, Inc., CA, USA) using frequency distributions to assess the nuclear area (a and b), nuclear:cytoplasm NF-κB p65 ratio (c and d), CD44+/- cells (e and f) and using bivariate analysis to assess expression of CD44 and the ratio nuclear:cytoplasmic NF-κB expression in single cells (g and h)