
Figure 4.
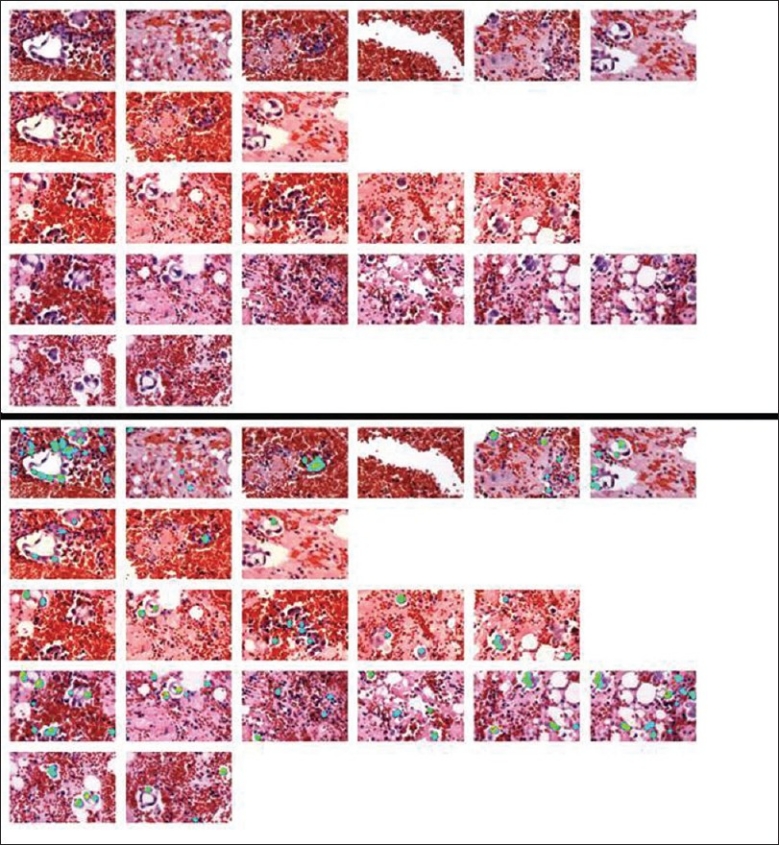
SIVQ analysis of the pleural effusion IMA. The top panel was loaded into SIVQ. A vector was selected from a tumor cell and was then used to search the image. A heatmap corresponding to the quality of matches is displayed in the lower panel.