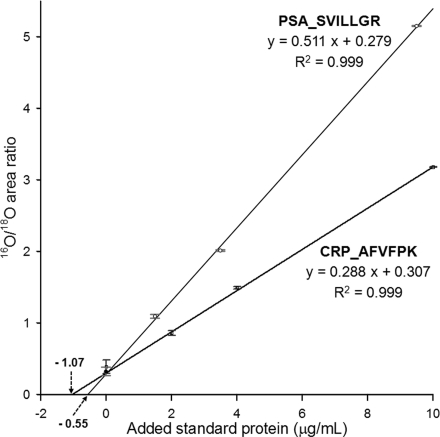
Fig. 7.
Quantification of PSA and CRP concentrations in plasma using the GIS coupled with the standard addition method. Standard addition curves of SVILLGR2+ (379.25 → 345.22) from spiked PSA and AFVFPK2+ (354.71 → 490.30) from endogenous CRP in human female plasma. The standard deviations are shown as error bars at all data points.

