Fig. 1.
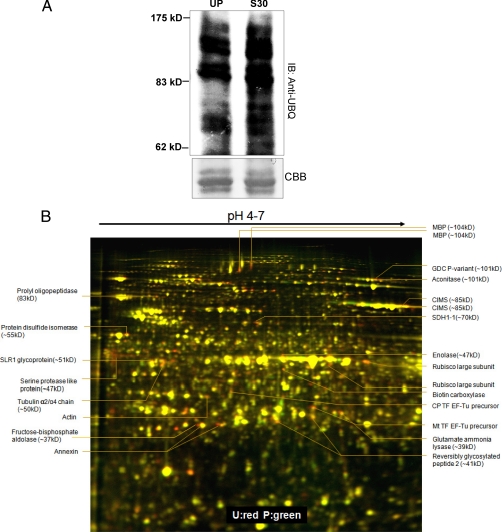
SI response leads to increased ubiquitination and down-regulation of a subset of proteins. A, Increased ubiquitination following SI (30min) was observed through Western blotting using anti-ubiquitin antibodies. B, Two-dimensional DIGE analysis of SI regulated proteins. Proteins from W1 stigmas either unpollinated (U) or pollinated (P) for 60 min with self-incompatible W1 pollen were compared through Two-dimensional DIGE using 24 cm pH 4–7 IPG strips followed by 12.5% SDS-PAGE. Proteins that are down-regulated by SI appear red and that are up-regulated following SI appear green and those that are unaffected are yellow. Interesting spots identified are marked with their respective identifications, the differentials predicted are shown in supplemental Fig. S1B and the fold changes are shown in Table I.

