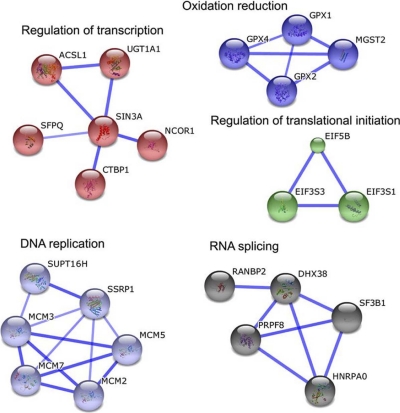
Fig. 3.
Colonopshere-enriched proteins display functional interactions. All colonosphere-enriched proteins (119) were analyzed against the STRING database for functional protein association networks. The strength of the associations is represented by line thickness. Networks with three or more protein interactions are shown. Required confidence (score) of protein association was 0.700 (high confidence).

