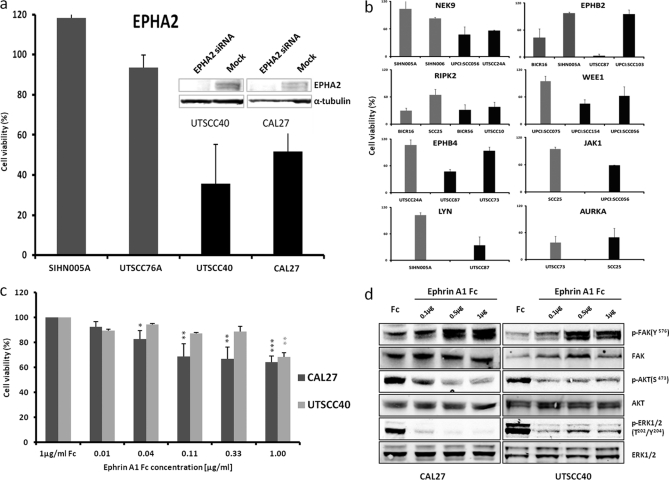
Fig. 4.
EPHA2 target validation. a, cell viability of low (gray) and high (black) EPHA2-expressing cell lines following EPHA2 protein knockdown by siRNA. EPHA2 protein levels are shown in the inset. b, example results from a siRNA screen of 29 differentially expressed kinases in the respective low (gray) and high (black) expressing cell lines. c, cell viability decreases in high EPHA2-expressing cell lines following treatment with Fc-conjugated Ephrin A1. d, signaling pathway analysis using phospho-specific antibodies reveals that Ephrin A1 treatment inhibits ERK and AKT and induces FAK phosphorylation.

